
Let’s face it—data analysis can feel overwhelming. Whether you’re staring at a spreadsheet full of sales figures, customer feedback, or inventory logs, the process of turning raw data into actionable insights can be time-consuming and, let’s be honest, a little tedious.
But what if I told you there’s a way to make this process faster, easier, and even a bit fun? Enter Microsoft Copilot for Excel, your new AI-powered sidekick that’s here to revolutionize how you work with data.
In this guide, we’ll walk through everything you need to know to master data analysis in Excel with Copilot. From accessing the tool to generating formulas, creating visualizations, and uncovering insights, you’ll learn how to transform raw data into meaningful stories—all while saving time and effort. So, grab your favorite beverage, open Excel, and let’s dive in!
What is Microsoft Copilot for Excel?
Microsoft Copilot is an AI-powered assistant integrated directly into Excel. Think of it as your personal data analyst, ready to help with everything from cleaning up messy data to creating complex formulas and stunning visualizations. It’s designed to make data analysis more accessible, whether you’re a beginner or a seasoned pro.
The best part? Copilot uses natural language processing, which means you can simply tell it what you need in plain English. No more Googling Excel formulas or spending hours figuring out how to create the perfect chart. Copilot does the heavy lifting, so you can focus on the insights that matter.
Getting Started: How to Access Copilot in Excel
Before you can start using Copilot, there are a few things you’ll need to do:
- Check Your License: Copilot is available to users with a Microsoft 365 Copilot license. If you don’t have one yet, you’ll need to upgrade your subscription.
- Save Your Workbook to the Cloud: Copilot only works with files stored on OneDrive or SharePoint. If your data is saved locally, upload it to the cloud first.
- Activate Copilot: Open your workbook, head to the Home tab on the Excel ribbon, and click the Copilot button. If it’s grayed out, double-check that your file is saved in the right location.
Once you’ve got Copilot up and running, you’re ready to start analyzing data like a pro.
Step 1: Preparing Your Data for Analysis
Even the smartest AI needs clean, well-organized data to work effectively. Here’s how to prep your data for Copilot:
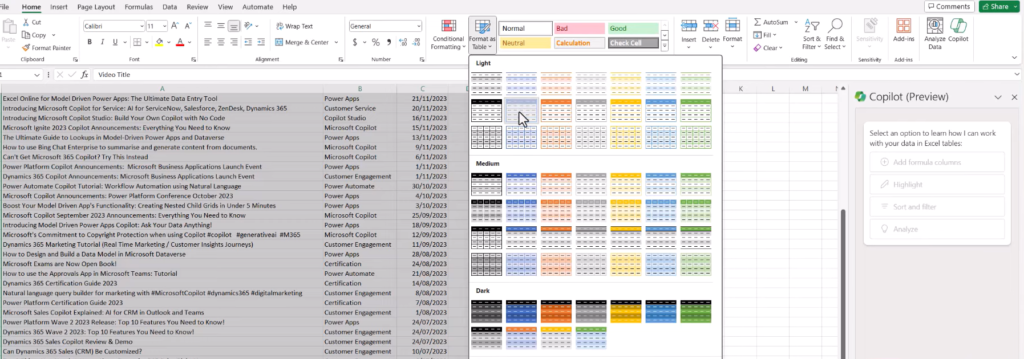
- Convert Your Data into a Table: Copilot works best with structured data. To convert your data into a table, select your range and press
Ctrl + T. Alternatively, you can ask Copilot to do it for you by typing, “Convert this range into a table.” - Clean Up Messy Data: Got duplicates, extra spaces, or inconsistent formatting? Copilot can help. For example, you can say, “Remove duplicates in Column A” or “Trim extra spaces in Column B.”
By taking a few minutes to clean and organize your data, you’ll set yourself up for smoother, more accurate analysis.
Step 2: Generating Formulas with Natural Language
One of the most powerful features of Copilot is its ability to generate formulas based on natural language prompts. No more memorizing complex syntax or searching for the right function—just tell Copilot what you need, and it’ll do the rest.

Here are a few examples:
- Basic Calculations: “Calculate the total revenue for Q1” → Copilot generates.
=SUM([@Q1 Revenue]) - Advanced Formulas: “Calculate the profit margin between Revenue and Cost” → Copilot suggests.
=([@Revenue]-[@Cost])/[@Revenue] - Conditional Logic: “Highlight rows where sales are above $10,000” → Copilot creates a conditional formatting rule.
Pro Tip: If you’re not sure how a formula works, click the Explain formula button to get a breakdown of its components. It’s like having a tutor right in your spreadsheet!
Step 3: Creating Visualizations in Seconds
Charts and graphs are essential for turning numbers into stories, but creating them can be a hassle. With Copilot, you can generate visualizations in seconds using simple prompts.

Here’s how it works:
- Ask for a Chart: Type something like, “Create a bar chart showing sales by region” or “Show a pie chart of product categories.”
- Review and Refine: Copilot will generate the chart in the preview pane. You can adjust the design, colors, or labels before inserting it into your worksheet.
- Explore Advanced Visuals: Need something more sophisticated, like a heatmap or scatter plot? Copilot’s Python integration (available in US English) can create custom visuals without requiring any coding knowledge .
Step 4: Summarizing Insights and Analyzing Trends
Once your data is clean, organized, and visualized, it’s time to uncover insights. Copilot excels at summarizing data and identifying trends, outliers, and correlations.
Here are a few ways to use it:
- Summarize Text Data: If you’re analyzing customer feedback, ask Copilot to “Group responses into themes” or “Identify the most common complaints.”
- Spot Trends: Type, “Show trends in monthly sales” → Copilot highlights patterns, like seasonal spikes or dips.
- Explore Outliers: Ask, “Are there any unusual values in this dataset?” → Copilot flags anomalies for further investigation.
For deeper analysis, you can even use Copilot to run what-if scenarios. For example, “What happens to profit if we increase prices by 10%?” → Copilot models the potential impact and shows you the results.
Step 5: Advanced Features for Power Users
If you’re a data scientist or advanced analyst, Copilot has some extra tricks up its sleeve:
- Python Integration: Copilot can generate Python code for tasks like machine learning, predictive analytics, and custom visualizations. Just ask, “Write Python code to forecast next quarter’s sales” → Copilot delivers ready-to-use scripts .
- VBA Automation: Need to automate repetitive tasks? Copilot can write VBA macros for you. For example, “Create a macro to format this report” → Copilot generates the code and walks you through how to use it .
Copilot vs. Traditional Excel: A Quick Comparison
To give you a sense of how much time and effort Copilot can save, here’s a side-by-side comparison:
| Task | Traditional Excel | Copilot-Enhanced Excel |
|---|---|---|
| Formula Creation | Manual syntax entry | Natural language prompts |
| Data Visualization | Manual chart setup | Instant AI-generated visuals |
| Text Analysis | Manual reading/categorizing | Automated themes & sentiment |
| Data Cleaning | Manual filtering/trimming | One-click cleanup commands |
| Advanced Analytics | Requires Python/VBA expertise | Code auto-generated via prompts |
As you can see, Copilot streamlines every step of the data analysis process, making it faster and more intuitive.
Tips for Getting the Most Out of Copilot
To make the most of Copilot, keep these best practices in mind:
- Be Specific: The more detailed your prompts, the better the results. Instead of “Analyze sales,” try “Show the top 3 products by Q3 revenue.”
- Verify Outputs: While Copilot is incredibly smart, it’s not perfect. Always double-check formulas, charts, and insights for accuracy.
- Experiment with Prompts: Don’t be afraid to try different prompts to see what Copilot can do. You might be surprised by its capabilities!
Real-World Example: Transforming Customer Feedback
Let’s say you’re analyzing 1,000 survey responses. Traditionally, this might take days. With Copilot, you can:
- Summarize: “Group feedback into themes” → Instantly identifies key issues.
- Filter: “Focus on negative reviews” → Highlights urgent areas like “shipping delays.”
- Visualize: “Create a pie chart of sentiment distribution” → Shares a clear snapshot with stakeholders.
In just a few clicks, you’ve turned a mountain of text into actionable insights.
The Future of Data Analysis is Here
Microsoft Copilot for Excel isn’t just a tool—it’s a game-changer. By automating repetitive tasks and providing intelligent suggestions, it empowers users to focus on what really matters: uncovering insights and making data-driven decisions.
Whether you’re a beginner looking to simplify your workflow or an advanced user exploring Python and machine learning, Copilot has something for everyone. So why not give it a try? Open Excel, activate Copilot, and see how it can transform the way you work with data.
2 Comments
Pingback: Google Gemini vs Microsoft Copilot: Features, Cost & Advice - The Lalit Blogs
Pingback: Microsoft Copilot Features 2025 : All Major Features & Updates - The Lalit Blogs